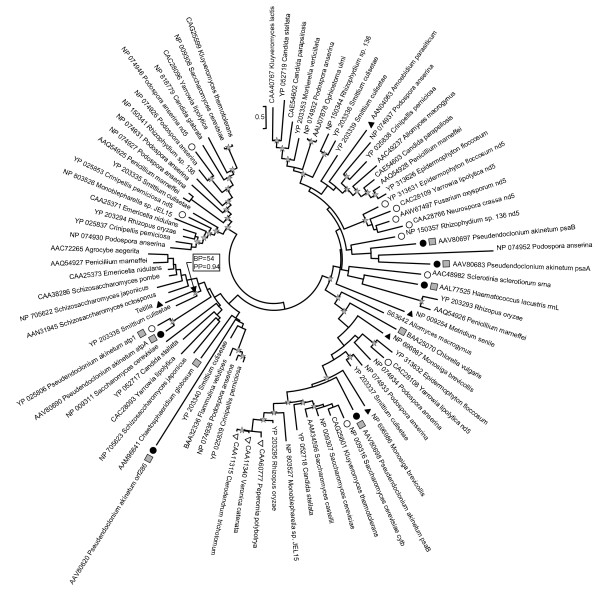
Figure 5.
Maximum likelihood phylogenetic trees of LAGLIDADG protein sequences. The circular tree presentation has been adopted to highlight the fact that the tree is unrooted. Most of the sequences were located in introns present in mitochondrial cox1 genes of Fungi. Sequences originating from introns located in other mitochondrial genes are indicated by white circles and chloroplast sequences are indicated by black circles. The gene at the origin of these sequences is indicated after the species name. Black triangles characterize animals and their closest outgroups (i.e., Monosiga brevicollis, Choanoflagellida; and Amoebidium parasiticum, Ichthyosporea). White triangles characterize plant sequences and grey squares indicate sequences from green algae. All the remaining sequences are from fungi. Stars indicate nodes supported by a ML bootstrap support (BP) ≥ 50% and a Bayesian posterior probability (PP) ≥ 0.90. Support values are indicated for the key node Tetilla + Smittium.

