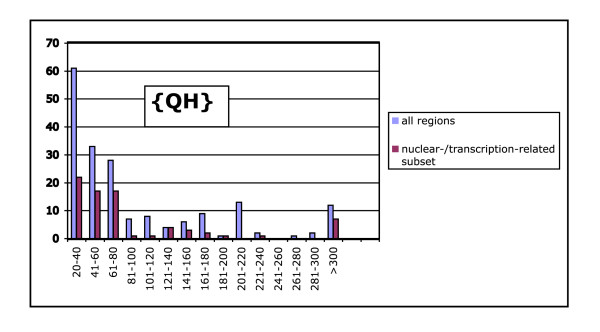
Figure 2.
Distribution of lengths of {QH} regions in D. melanogaster. There are two histograms: the overall distribution (red bars), and the nuclear- or transcription-related proteins (blue bars). The nuclear- and transcription-related proteins have been compiled by grouping together all proteins that have been assigned one of the GO terms that has been adjudged transcription-related (See main text for details).

