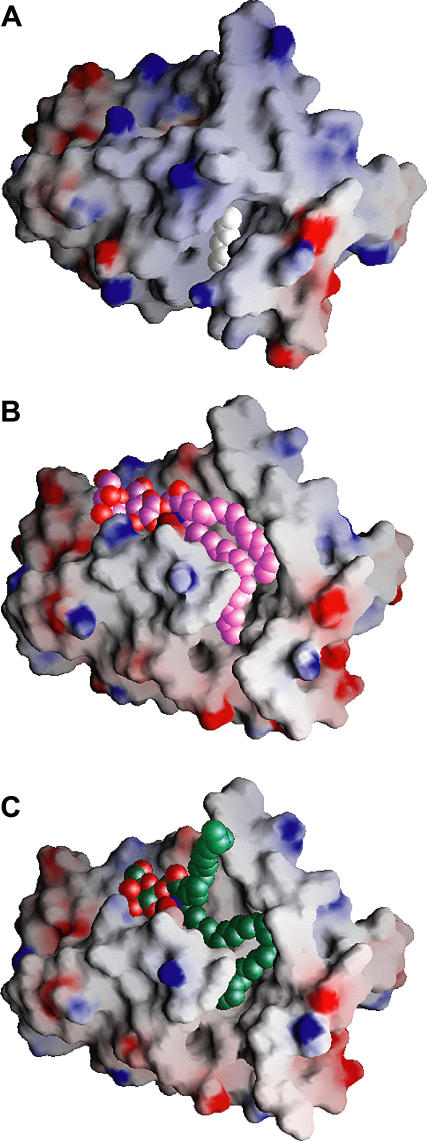
Figure 3. Gate-Removed Electrostatic Surface Views of the GLTP Hydrophobic Tunnel Accommodating GSLs and/or Extraneous Hydrocarbons.
(A) Structure of apo-GLTP. The GLTP is shown in an electrostatic surface representation (blue, positive; red, negative; gray, neutral), with gate residues 33 and 35 to 39 removed to make the tunnel visible in (A), and residues 33 and 35 to 45 removed in (B) and (C). The view for apo-GLTP shows the collapsed upper part of the tunnel and bound extraneous hydrocarbon positioned within the uncollapsed bottom of the tunnel. The carbon atoms of the extraneous hydrocarbon are shown in a white space-filling representation.
(B) Structure of the 18:1 LacCer-GLTP complex exhibiting the sphingosine-in mode. The carbon atoms of the 18:1 LacCer are shown in a lavender space-filling representation. Both lipid chains optimally fit into the available space of the hydrophobic tunnel.
(C) Structure of the 24:1 GalCer-GLTP complex exhibiting the sphingosine-out mode. The carbon atoms of the 24:1 GalCer are shown in a green space-filling representation. The long acyl chain, bent in a serpentine fashion, occupies the available space of the hydrophobic tunnel, resulting in an outward positioning of the sphingosine chain.

