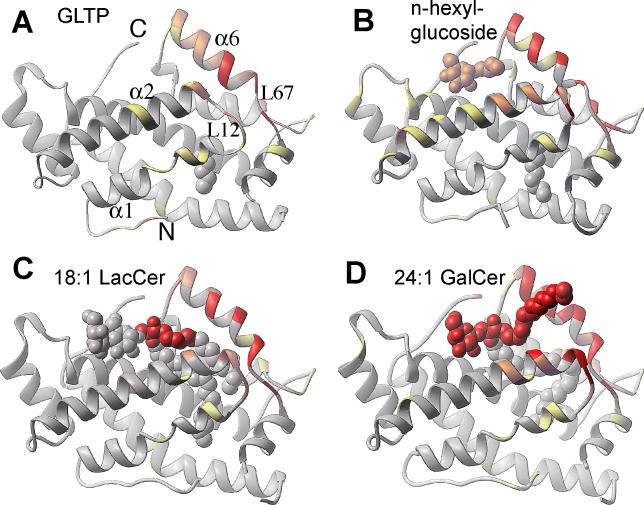
Figure 9. Distribution of the Protein-Protein and Protein-Membrane Interaction Propensities over the GLTP Surface Calculated by the ODA Approach for Four Different GLTP Conformational States.
(A) apo-GLTP with an extraneous hydrocarbon.
(B) GLTP complex with n-hexyl-β-d-glucoside.
(C) Sphingosine-in GLTP complex with 18:1 LacCer.
(D) Sphingosine-out GLTP complex with 24:1 GalCer.
Structures are colored by the absolute magnitude of the ODA signal from the strongest in red, through medium in orange and weak in yellow, to the weakest in gray.

