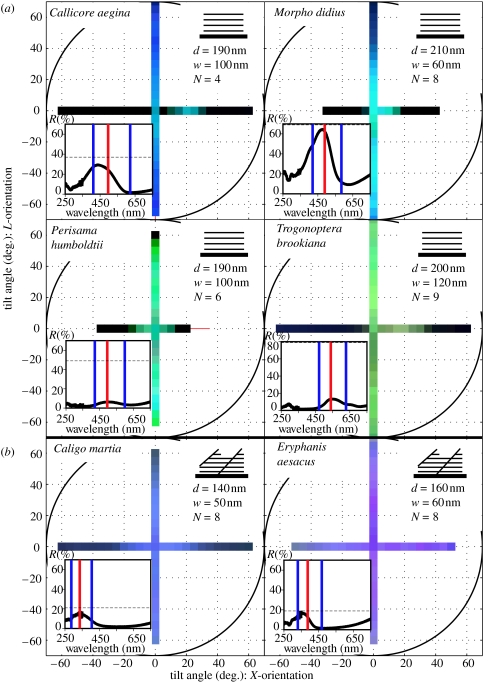
Figure 2.
Angle-dependent spectral measurements of the (a), ridge-lamellae and (b), microrib butterflies. Structural characteristics from the SEM images: the periodicity (d), and width (w) of the layers and the average number of layers (N), are given in the insets on the top right of each set of results. The insets on the bottom left of each set of results show the integrated normal incidence spectrum from the Cary measurement. The predicted peak wavelength (red line), FWHM spectral bandwidth (blue lines) and peak reflectance (dotted line) from a simple thin film analysis with the refractive index of chitin (n=1.56) are also shown on the normal incidence plot. This predicted reflectance value is corrected by the percentage of the scale actually covered in the reflecting structure (the coverage, C). As this inset is a multi-scale measurement, the presence of scattered non-coloured scales in the sample area of P. humboldtii and T. brookiana results in peak reflectance measurements that are an underestimate of the true absolute value, therefore giving a disagreement with the predicted intensity.

