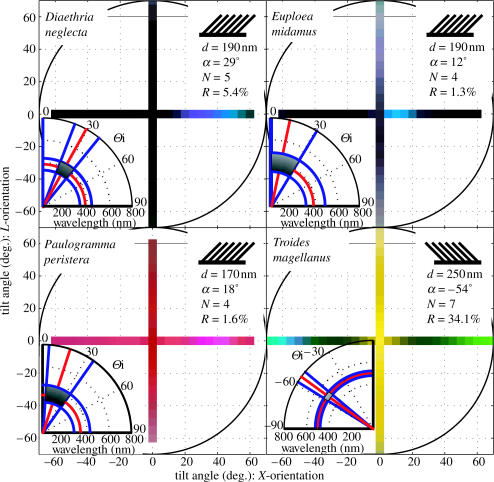
Figure 3.
Angle-dependent spectral measurements of the four tilted multi-layer butterflies. The tristimulus values for each species are normalized to aid colour reproduction. The peak intensity of the reflection (R) and the periodicity (d), tilt angle (a) and number of layers (N) found in each structure are given in the insets on the top right of each set of results. The insets on the bottom left of each set of results show the theoretical prediction of the wavelength and X-tilt angle range of the strongest reflection as predicted by the bi-grating analysis.

