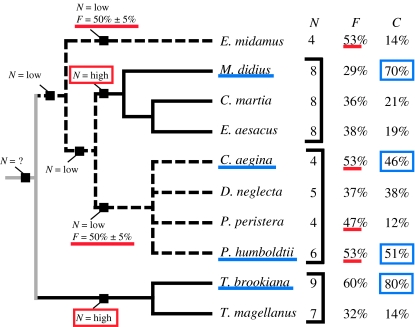
Figure 5.
Phylogeny of the butterflies showing structural features relating to the intensity of the reflected colour, such as the number of layers (N), the filling fraction (F), and the percentage of the wing scale covered in reflecting elements (C). Some of these traits, such as N and F, follow the phylogenetic distribution of the species, and the ancestral traits predicted by a simple parsimony analysis (Fitch 1971) are shown. A black line indicates N=high, a broken line indicates N=low, and a grey line indicates the number of layers is ambiguous. The coverage is more closely correlated with the occurrence of the ridge-lamellae structure, underlined in blue.

