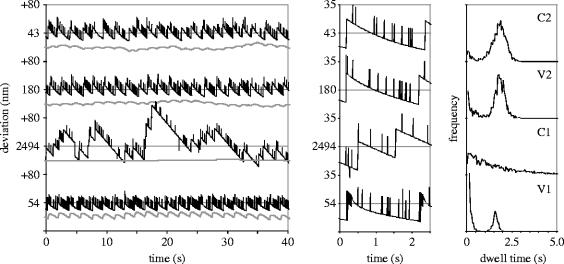
Figure 4.
Behaviour of systems with different spring characteristics, all moving at an average velocity of 20 nm s−1. Panels from top to bottom: C2, V2, C1, V1. Left panels: variation of the spring extension (black lines) and cargo position (grey lines) around their averages (whose values are indicated; the cargo positions have been offset by −40 nm). Middle panels: close-up of the spring extension trajectories over 2.5 s. c: distribution of the dwell times (interval between two full S1–S0–S1 transitions, including the ‘unsuccessful’ ones).

