Figure 4.
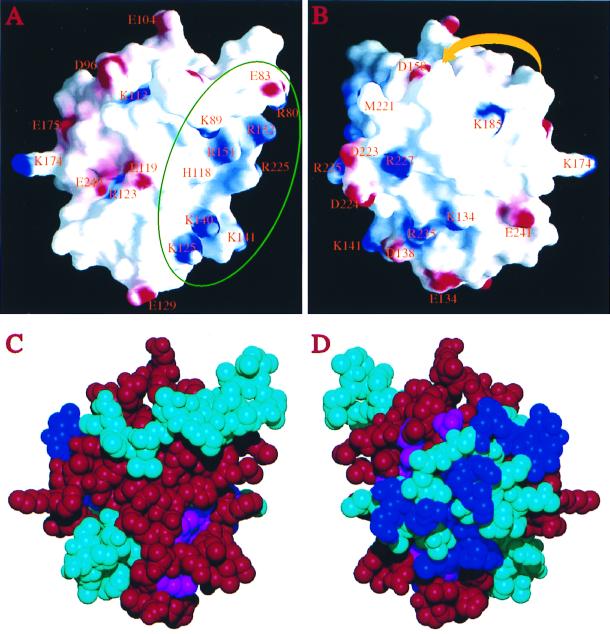
Surface characteristics of the Prp18Δ79 structure. (A) Electrostatic potential on the protein surface, viewed from a similar direction as in Fig. 2A. Positive charges are shown in blue, negative charges in red. Charged residues are labeled by their standard single-letter code followed by the residue number in the sequence. The green circle identifies the proposed Slu7-interacting area. His-118 on α2 is also labeled, although histidines are not included in calculating the electric potential on the surface (charges were assigned only to Lys and Arg, Asp and Glu). The surface was calculated by using a probe radius of 1.4 Å, and the potential is displayed at a −15 kBT to + 15 kBT scale, where kB is the Boltzmann constant. The region on the right side concentrated with positively charged residues is the putative Slu7-binding region. (B) Rear view (the protein is rotated 180° with respect to a vertical axis). The yellow arrowheaded ribbon indicates schematically the location of the disordered segment in loop-5. The direction of the arrowhead indicates the amino to carboxyl direction of the segment. The figures were generated with the program grasp (44). (C) Corey–Pauling–Koltun representation of the Prp18Δ79 structure viewed from the same direction as in A. Residues implicated in interacting with Slu7 by the two-hybrid method are colored red; conserved residues (S. cerevisiae residues shared by three or more other species as shown in Fig. 1) are colored blue; conserved residues that lie within the Slu7 interacting region are colored magenta, and all others are colored cyan. (D) Rear view. Most invariant residues are located on this side of the surface (the disordered segment of loop-5 is not shown, but it is also expected to be located on this side of the protein). These residues are not involved in interacting with Slu7.

