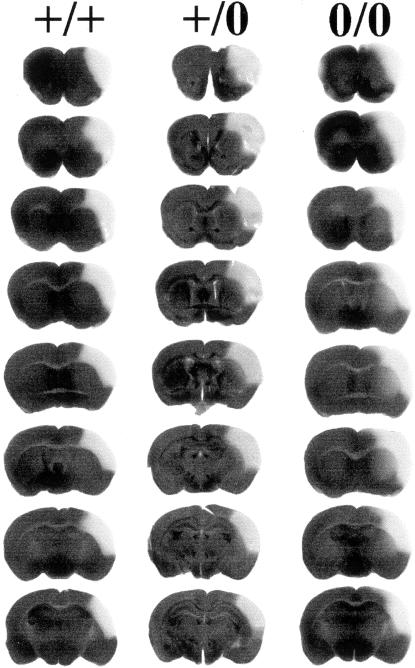
Figure 3.
Serial slices through the infarcted brain after staining with tetrazolium blue chloride. Serial slices from co-ordinates F +1.8 to F −1.6. The damaged regions can be seen as pale areas on the left-hand hemisphere. It can be seen that the damage in the PrP0/0 mice is more widespread than the other two lines. Note that the full range of the damaged area has not been shown. The data shown in Table 4 includes all slices with damage. Left, PrP+/+; middle, PrP+/0; and right, PrP0/0.

