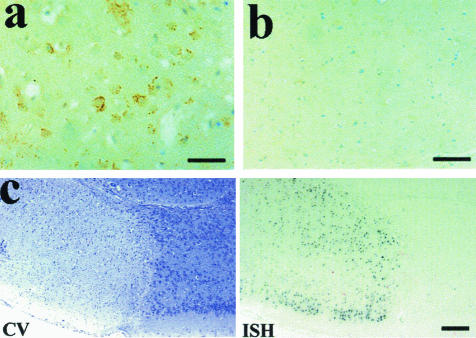
Figure 5.
Analysis of MCA occlusion in the mouse. a: The PrP signal from the ischemic region of the mouse brain showing large amounts of protein deposition. b: The contralateral control region treated with the same antibodies. c: A cresyl violet stain (CV) showing the ischemic lesion as a pale area (left) and the in situ hybridization signal for PrP mRNA from the cells in the penumbra of the lesion (right). Scale bars: 100 μm (a, b); 200 μm (c).

