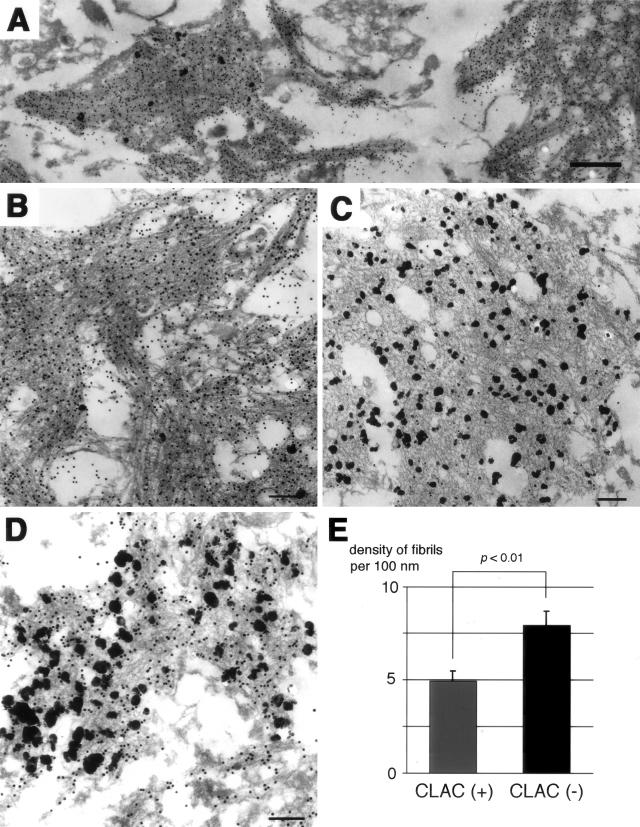
Figure 3.
Double immunoelectron microscopic analysis of amyloid deposits in the frontal neocortices of AD brains. A–C, Aβ40 (post-embedding, BA27, 10 nm gold) and CLAC (pre-embedding, 9D2, 1 nm immunogold/silver intensification). All electron micrograms in A–C were taken at different areas on an identical ultra-thin section. D: Aβ42 (post-embedding, BC05, 10 nm gold) and CLAC (pre-embedding, 9D2, 1 nm immunogold/silver intensification). Bar: A, 500 nm; B–D, 200 nm. E: Densities of amyloid fibrils per 100 nm width within CLAC-positive and -negative amyloid bundles in B and C measured at 30 points (mean ± SE).

