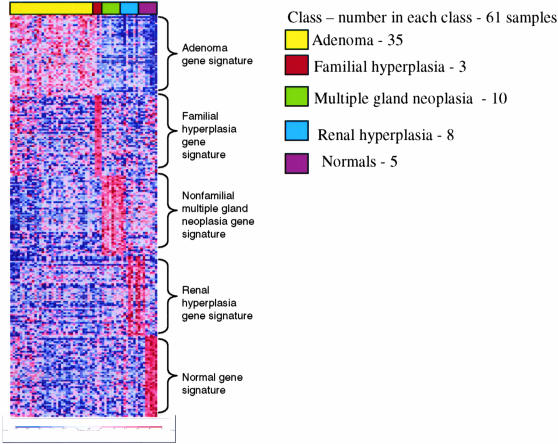
Figure 2.
Supervised analysis. Results of supervised clustering with gene ranking by differential expression using a signal-to-noise feature in a multiclass comparison of all parathyroid classes with the cases of recurrent hyperparathyroidism grouped with the cases of nonfamilial hyperplasia and represented as nonfamilial multiple gland neoplasia. Each class of samples is assigned a set of random colors for easier visualization of the data. The data are presented as the same format as described in Figure 1. Results represent the top 50 overexpressed genes (gene signature) for each class. Note that cases of recurrent hyperparathyroidism grouped with the cases of nonfamilial hyperplasia show a distinct gene signature similar to their individual representation in Figure 1.

