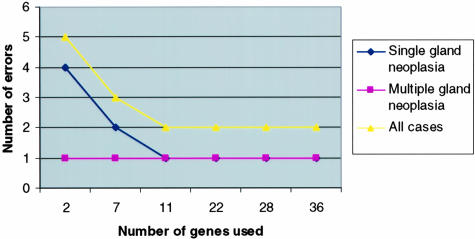
Figure 3.
Class distinction prediction models. The error rate of various predictor models by a leave-one-out cross validation for the class distinction of single versus multiple gland neoplasia is depicted for each group classification as well as the sum of errors for both groups. The predictor models illustrated used from 2 to 36 genes for classification. Shown are the number of errors for the 45 cases of sporadic parathyroid neoplasia (35 single and 10 multiple gland neoplasia). Note that whereas as few as two genes used in the model resulted in as few as five total errors, the best predictor model using 11 genes made only two errors.

