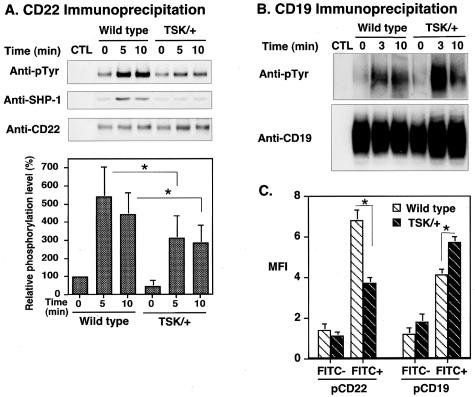
Figure 5.
Phosphorylation of CD22 and CD19 after BCR ligation. A and B: Lysates of TSK/+ and wild-type B cells (107/lane) treated as in Figure 4, and CD22 or CD19 was immunoprecipitated from the lysate. Immunoprecipitated proteins were subjected to SDS-PAGE and transferred onto membranes for anti-pTyr and/or SHP-1immunoblotting. The blots were subsequently stripped and reprobed with anti-CD22 or anti-CD19 Ab. Relative phosphorylation levels of CD22 are shown in the bottom graph which represent the relative mean optical density (± SEM) of band intensities determined by scanning densitometry from five independent immunoblotting experiments. Phosphorylation levels are shown as percentage of wild-type B cells at 0 minutes defined as 100%. C: Wild-type and TSK/+ mice were immunized with TNP-ficoll, and splenic B cells were purified on day 7. B cells were stimulated with FITC-conjugated TNP-ficoll for 5 minutes. FITC-positive (antigen-specific) and FITC-negative (not antigen-specific) cells were analyzed for CD19 and CD22 tyrosine phosphorylation by flow cytometry using anti-phosphoCD22 and anti-phosphoCD19 antibodies. FITC-negative cells showed no significant difference in CD22 and CD19 phosphorylation levels before and after stimulation. *, <0.05.

