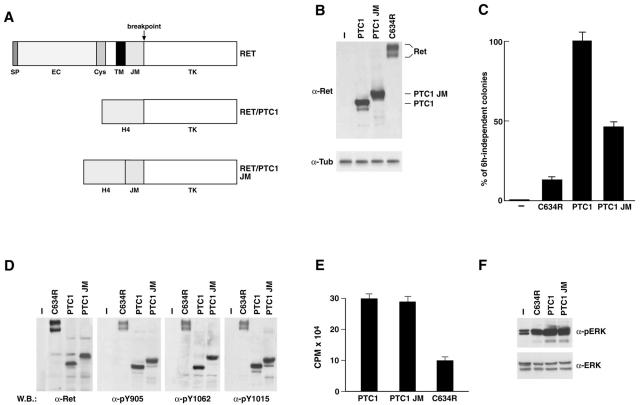
Figure 5.
A: Schematic representation of RET constructs. B: Expression levels of the various RET proteins in mass populations of transfected or parental (−) PC Cl 3 cells. Fifty μg of protein lysates were analyzed by Western blot with anti-RET(TK) antibodies. Antibodies directed against tubulin were used for normalization. C: The hormone-independent proliferation of the various PC Cl 3 transfectants is reported as percentage of G418-resistant cells forming colonies after 15 days of incubation in the absence of 6H. Average results of three independent experiments ± SD. D: Equal amounts (100 μg) of protein extracts of transfected PC Cl 3 or parental (−) cells were immunoblotted with anti-RET or with phosphorylation-specific anti-RET antibodies. The results are representative of at least three independent assays. E: In vitro poly-GT phosphorylation assay. The results of three independent experiments were averaged ± SD. F: Cell lysates (100 μg) were immunoblotted with anti-phospho-ERK and anti-ERK.

