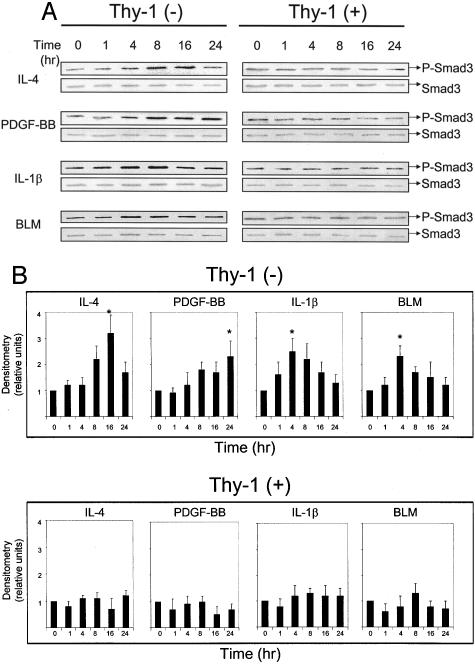
Figure 2.
Thy-1 (−) fibroblasts increase Smad3 phosphorylation in response to cytokines or BLM. A: Quiescent cells were treated with 10 ng/ml of IL-4, 20 ng/ml of PDGF-BB, 5 ng/ml of IL-1β, or 1 μg/ml of BLM. Cell lysates were collected at 0, 1, 4, 8, 16, and 24 hours. Levels of phosphorylated Smad3 (p-Smad3) and total Smad3 were detected in samples (equal protein loading) by immunoblotting. B: Relative p-Smad3 levels were determined by scanning densitometry of the blots and normalized to total Smad3 levels. The level of p-Smad3 at 0 hours of each treatment was set to 1. Results are the means of three independent experiments each performed in triplicate ± SD. *, P < 0.01 for basal control versus IL-4 at 16 hours, PDGF-BB at 24 hours, IL-1β at 4 hours, or BLM at 4 hours in Thy-1 (−) cells.

