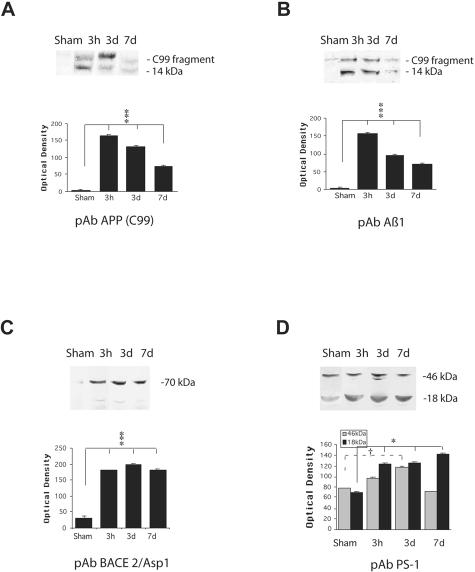
Figure 9.
Western blot analysis of APP C99 fragment (14 kd), BACE, and PS-1 in injured and sham brain white matter. Primary antibodies used are listed below graphs. Quantitative analysis of the protein expression is shown graphically, with mean values and SE of optical density of immunostaining from two separate experiments. P values refer to comparison between groups of injured animals and sham. *, P < 0.05; ***, P < 0.001; †, P < 0.05.

