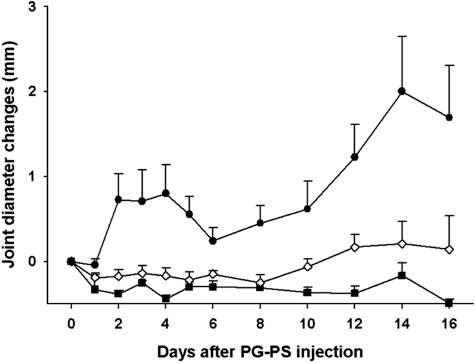
Figure 1.
Joint diameter changes. Comparison of the daily joint diameter changes between the disease-untreated group (filled circle; group III, PG-PS + MOPC-21), the disease-treated group (open diamond; group II, PG-PS + C11C1), and the negative control group (filled square; group I, saline + saline). Values are recorded as mean ± SEM (n = 6 to 8).

