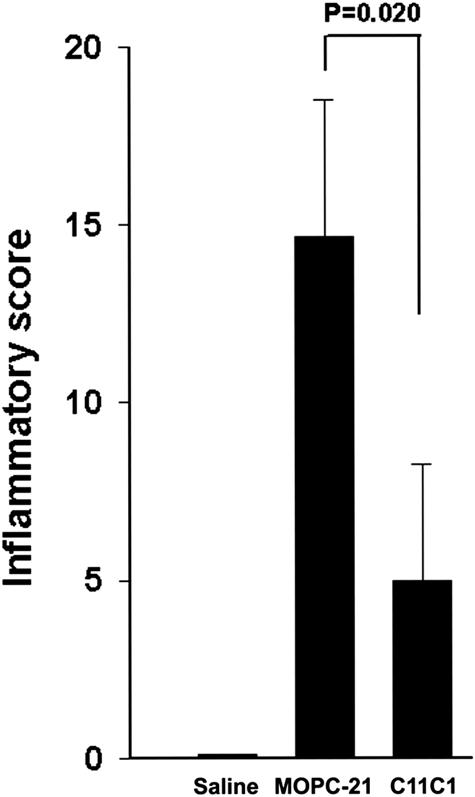
Figure 3.
Hind paw inflammatory score. Comparison of the disease-untreated group (group III, PG-PS + MOPC-21), the disease-treated group (group II, PG-PS + C11C1), and the negative control group (group I, saline + saline). Results are plotted as mean ± SEM (n = 6 to 8). Because of the skewed results, we applied the Mann-Whitney rank sum test for statistical analysis.

