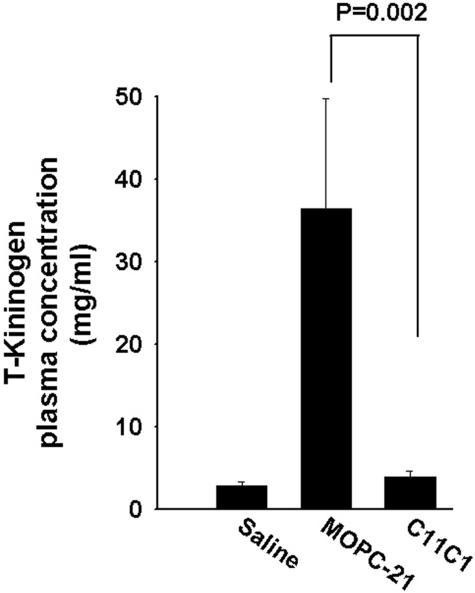
Figure 5.
Plasma T-kininogen antigenic levels. Comparison of negative control, disease-treated (group II, PG-PS + C11C1), and disease-untreated (group III, PG-PS + MOPC-21) groups are shown. Only the disease-untreated group (group III) was significantly increased over the other two groups. Student-Newman-Keuls test was applied for statistical analysis.

