Figure 2.
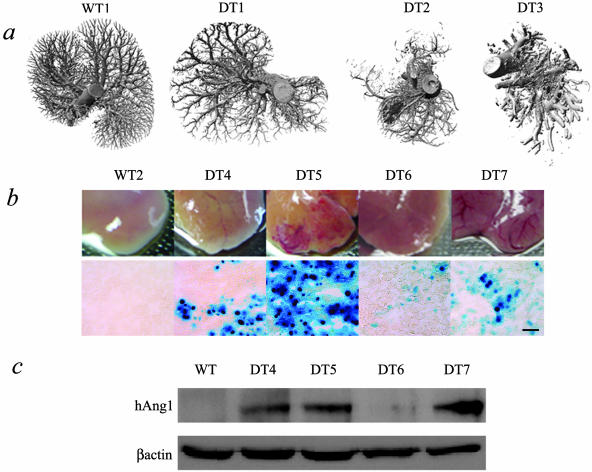
DT mice with more severe phenotypes express more transgenic Ang-1 protein. a: Micro-CT images demonstrate overall vascular phenotypes of WT and DT livers. Some DT livers (DT1) appeared remarkably normal whereas others showed a range of severity (DT2 to DT3). WT and ST mouse (ST shown) livers at the gross morphological level (middle row, b) display the characteristic smooth capsular surface with no visible veins, consistent with normal liver morphology whereas the DT (DT4 to DT7) livers show a range of phenotype consisting of small to very large increases in dilatation of veins under the capsular surface. The range of phenotype corresponds to levels of LacZ staining (bottom row of b) and levels of transgenic Ang-1 protein expressed in the livers of these mice (c), such that mice with severe phenotypes (DT5 and DT7) have more LacZ staining and express more transgenic Ang-1 protein. Scale bar, 100 μm.

