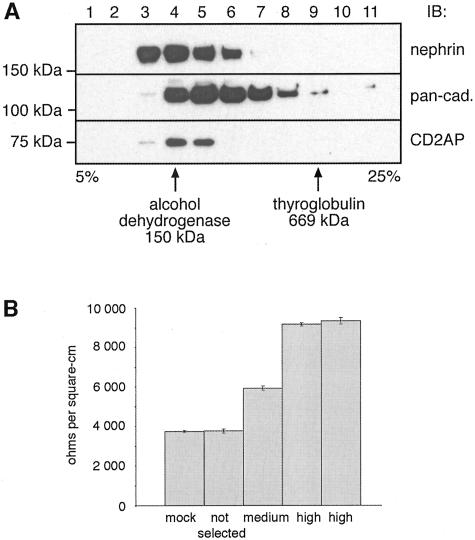
Figure 7.
A: Nephrin, cadherins, and CD2AP co-sediment by sucrose velocity gradient centrifugation. MDCK-nephrin cells were lysed, loaded on top of a 5 to 25% continuous sucrose gradient and centrifuged as described in Materials and Methods. One-ml fractions were collected and a 40-μl aliquot of each fraction was separated by SDS-PAGE followed by immunoblotting with anti-nephrin 043, anti-pan-cadherin, and anti-CD2AP 1774 IgG. The locations of protein standards (alcohol dehydrogenase, 150 kd; and thyroglobulin, 669 kd) is indicated. Nephrin and cadherins have a broad distribution in the gradient with cadherins found in fractions 4 to 9 and nephrin in fractions 3 to 6. CD2AP is detected in fractions 4 and 5. B: Expression of nephrin increases the TER of MDCK cell monolayers. In MDCK cell clones expressing medium and high levels of nephrin TER is increased 1.6- and 2.5-fold (average: 5950, 9170, and 9350 ohms/cm2, respectively) compared to control MDCK cells (mock; average, 3740 ohms/cm2). TER values of a mixed population (not selected) of MDCK-nephrin cells are similar (average, 3760 ohms/cm2) to those of control MDCK cells. Cells were cultured on filters and TER was measured with a Millipore ERS electrical resistance system. Values are mean ± SD of four individual cell culture inserts of one representative experiment. The same result was obtained in three separate experiments.

