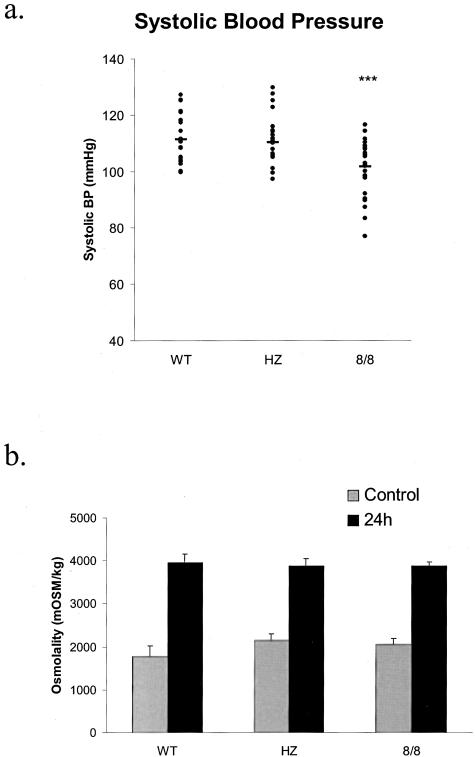
Figure 6.
a: Systolic blood pressure was determined using an automated tail-cuff manometer for 4 consecutive days. The animals are 22 wild-type (WT), 25 heterozygous (HZ), and 28 ACE 8/8 mice. Each dot represents the systolic blood pressure of a single mouse. A solid bar represents the mean for each group of mice. The systolic blood pressure of ACE 8/8 mice was significantly lower than wild-type and heterozygous mice. ***, P < 0.001. b: Urine osmolality was determined from spot samples collected from wild-type (WT), heterozygous (HZ), and ACE 8/8 mice before and after 24-hour water deprivation. All three groups of mice showed a similar increase in urine osmolality following water deprivation. The number of mice in each group was 12 WT, 12 HZ, and 15 8/8. All data are means ± SEM.

