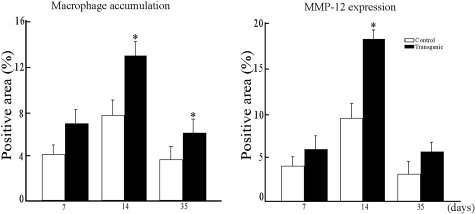
Figure 4-4264.
Immunostaining intensity of macrophages (left) and MMP-12 (right). Quantitative analysis of macrophage accumulation and MMP-12 expression was performed using Macscope image analysis as described in Materials and Methods. Data are expressed as the average percentage of immunopositive area within the joint cavity (n = 4 for each group). *, P < 0.05 versus control.

