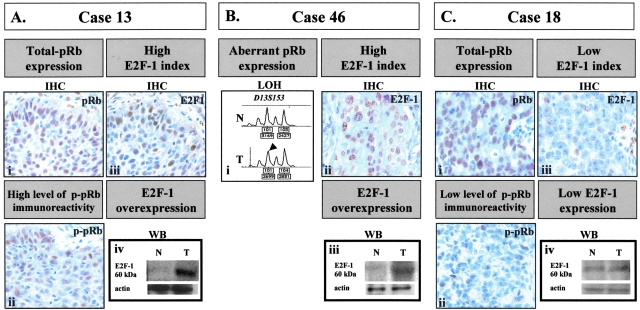
Figure 4-4261.
Representative results of E2F-1 analysis in two cases (cases 13 and 46) demonstrating high E2F-1 labeling index and a third one (case 18) displaying low E2F-1 expression levels. In case 13, E2F-1 overexpression was associated with inactivation of pRb (as revealed by p-pRb immunoreactivity in serial sections). In case 46, E2F-1 overexpression was accompanied by deregulated total pRb expression (absence of immunostaining that was associated with pRb LOH). For comparison, in case 18 the observed lower EI (as assessed also by Western blot analysis) was associated with a lower degree of p-pRb immunoreactivity. As described in the Materials and Methods section, the following assays are presented in the figure: for pRb status: IHC against total pRb and p-pRb, and LOH analysis using the D13S153 internal pRb microsatellite marker [the arrowhead indicates allelic loss as estimated by the densitometric values (presented in the corresponding boxes below the chart) based on previously described criteria32]; for E2F-1: IHC and Western blot analysis.

