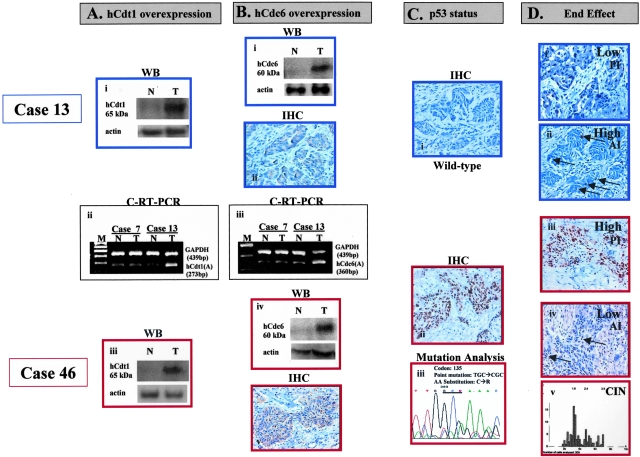
Figure 6-4261.
Representative results showing downstream events associated with overexpression of hCdt1 and hCdc6 in two cases (cases 13 and 46). In case 13 bearing wild-type p53, low proliferation and high apoptotic indices were observed. On the other hand, in case 46 harboring mutant p53 (C135R), high proliferation and low apoptotic indices, as well as, CIN (aneuploidy) were recorded. As described in the Materials and Methods section the following assays are presented in the figure: for hCdt1: C-RT-PCR and Western blot analysis; for hCdc6: C-RT-PCR, Western blot and IHC analysis; for p53: IHC and sequencing analysis; for proliferation: IHC against Ki-67; for apoptosis: TUNEL assay (apoptotic nuclei are depicted by arrows); for CIN: ploidy analysis (the x axis represents nuclear DNA quantity in c units, whereas y axis corresponds to the number of evaluated nuclei).

