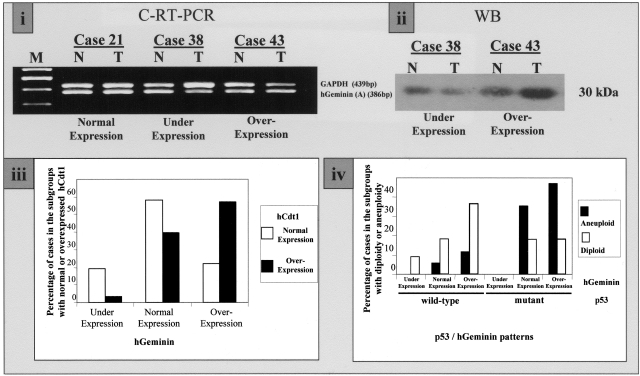
Figure 8-4261.
i: Representative C-RT-PCR analysis of matched normal (N)-tumor (T) tissues from cases 21, 38, and 43, showing normal, underexpression, and overexpression of hGeminin, respectively. ii: Representative Western blot analysis of two paired N-T cases (cases 38 and 43), confirming the previously observed underexpression and overexpression of hGeminin by C-RT-PCR in i. iii: Bar chart depicting the percentage of tumors exhibiting normal (white bars) and overexpressed hCdt1 (black bars) when hGeminin was evaluated as underexpressed, normal, and overexpressed. iv: Bar chart depicting the percentage of aneuploid (black bars) and diploid (white bars) cases according to the p53/hGeminin patterns.

