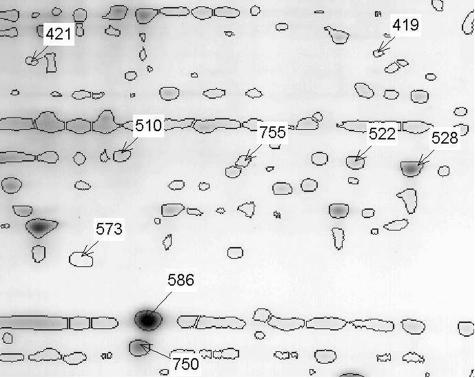
Figure 1.
Two-dimensional gel map of pooled spinal cord extracts from five WT animals containing the spots with significant abundance changes. Areas containing the Stathmin spot and the Hsp25 spot are compared in greater detail in Figure 2 (under A for Stathmin and B for Hsp25). The location of the spots with significant and greater than twofold abundance differences between the mutant and WT samples are labeled with their corresponding identification numbers. Note: in this and in the subsequent legends, WT is for mice that express the wild-type human SOD1.

