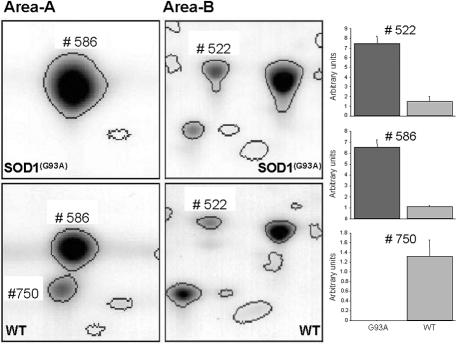
Figure 2.
Comparison of magnified gel areas (as highlighted in Figure 1) and spot abundance changes from WT and SOD1G93A mice. The left panel displays the gel areas of spot 586 (SOD1G93A) and spot 750 (Stathmin) (area A), and spot 522 (Hsp25) (area B) (compare also Figure 1) from a representative gel with protein extracts from five pooled spinal cords from SOD1G93A mice (top) and their controls (bottom). The bar plots on the right display the abundance differences of the corresponding spots. Hsp25 (spot 522) and SOD1G93A (spot 586) are more abundant in the SOD1G93A mice, whereas Stathmin (spot 750) is only present in the WT mice. Spot 586 in the WT samples, which is located in the same area as the SOD1G93A protein in the corresponding gels run with protein extracts from mutant mice, could not be identified using mass spectrometry, and is classified as unknown.

