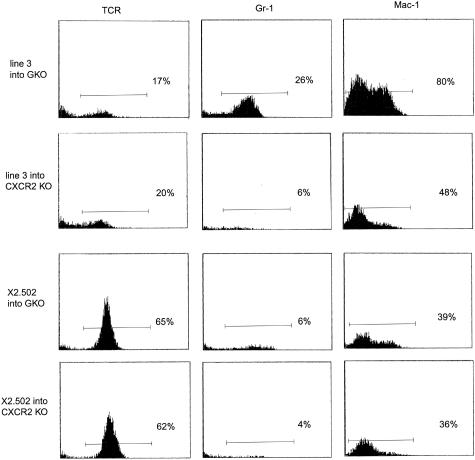
Figure 6.
Comparative quantitation of mononuclear cell composition from CNS of GKO versus CXCR2 KO recipients of line 3 (top rows) and clone X2.502 (bottom rows). Cells from diseased recipients were isolated by Percoll gradient 12 days after injection. Monoclonal antibodies were used to detect TCR+ cells (H57-597), neutrophils (anti-Gr-1), or Mac-1+ cells (anti-CD11b). Profiles shown are from individual representative mice; three to five mice per group were injected and analyzed.

