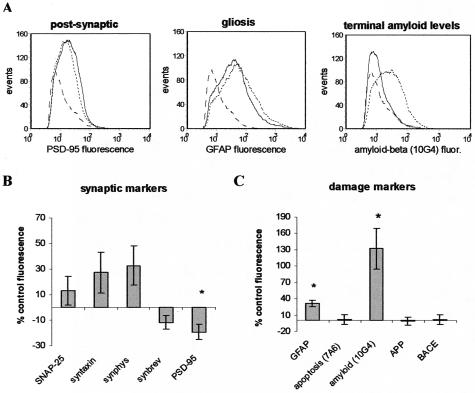
Figure 4.
Per particle fluorescence changes in AD synaptic terminals. A: Histograms demonstrate fluorescence from a representative case-control comparison for labeling with: PSD-95 (left), GFAP (middle), and Aβ (10G4; right). Dashed line indicates isotype-specific background staining; solid line is labeling in normal age-matched control; dotted line is labeling in AD case. Synaptic marker (B) and damage marker (C) fluorescence in AD cases expressed as percentage of control; data from 10 independent experiments (50,000 events/sample) is summarized in graph; *, P < 0.03, Student’s t-test.

