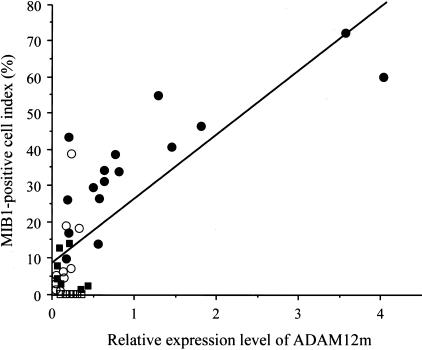
Figure 6.
Correlation between MIB1-positive cell index and ADAM12m mRNA expression levels. The relative mRNA expression levels of ADAM12m (ADAM12m/18s ribosomal RNA ratios) in astrocytic tumors were plotted against the MIB1-positive cell index. Note a direct correlation between the mRNA expression levels and the index (r = 0.791, P < 0.0001). ▪, low-grade astrocytomas (n = 7); ○, anaplastic astrocytomas (n = 9); •, glioblastomas (n = 16); □, nonneoplastic brain tissue (n = 6).

