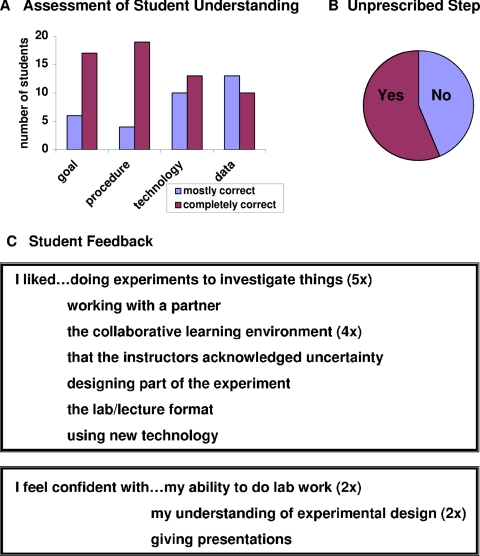
Figure 5.
Student learning outcomes. (A) A grading rubric was used to evaluate student understanding of the material presented and data collected. Each student presentation was evaluated for a clear statement of the experimental goal, a complete description of the experimental procedure, an accurate description of the experimental technology, and a justifiable interpretation of the data collected. A scale of 1–5 was used, where 1 is completely incorrect or missing information, 2 is mostly incorrect, 3 is equal amounts of correct and incorrect information, 4 is mostly correct, and 5 is a complete and correct presentation. (B) The sophistication of the students' data analysis was assessed by counting those who extended their explanations and findings beyond in a creative way, outside of any instruction. See text for examples. (C) A survey of open-ended questions was answered anonymously; only 10 of the classes' 23 students completed the questionnaire. Responses offered on more than one survey include the number of appearances in parentheses.

