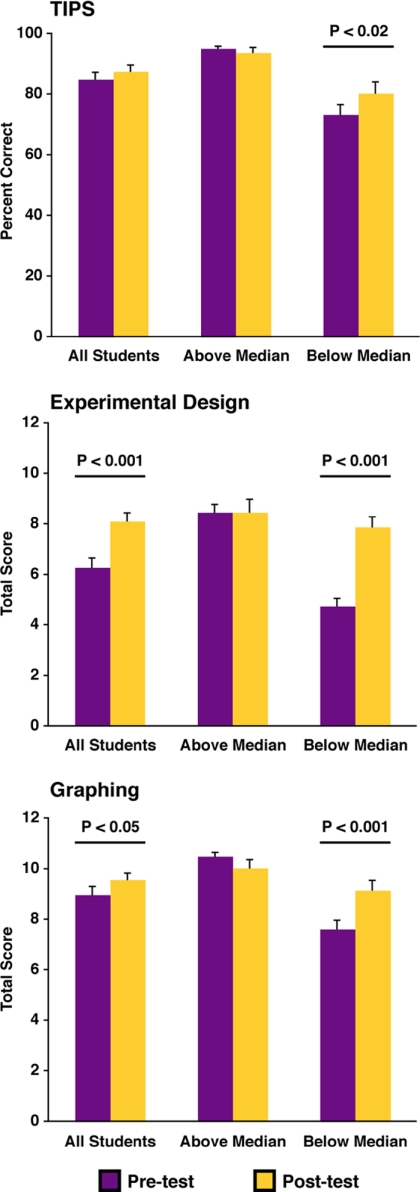
Figure 3.
Results of in-class assessments of TIPS (top), experimental design (middle), and graphing (bottom). Purple bars indicate pretest means and SEM, gold bars indicate posttest means and SEM. Above/Below median indicates groups of students whose pretest scores were above or below the median, respectively. p values indicate significant differences between pre- and posttest values, as determined by paired t test.

