Figure 2.
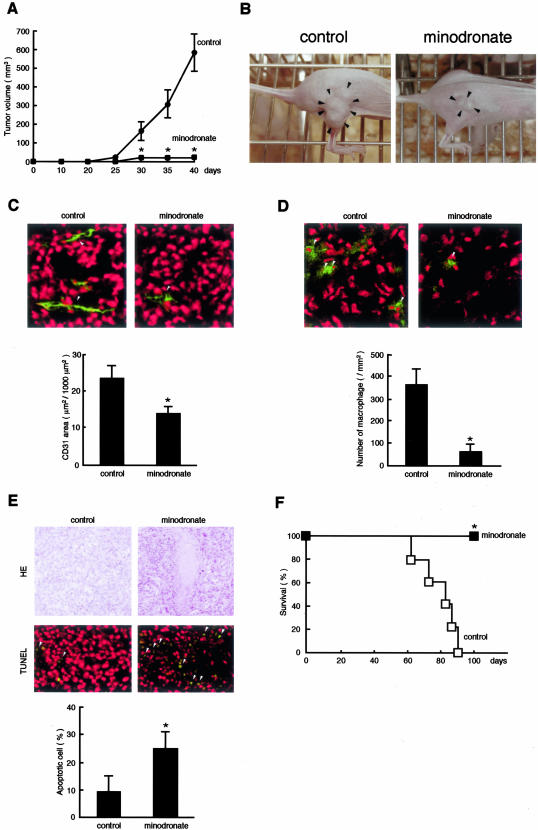
Effects of minodronate on tumor growth (A and B), angiogenesis (C), macrophage infiltration (D), apoptosis (E), and survival rate (F) in nude mice. A: Each group (minodronate-treated or nontreated control group) was composed of five athymic nude mice. B: Typical photographs were taken after 40 days of injection. Arrowheads indicate tumors. C: Five cryostat sections of tumor xenograft were stained. Green fluorescence-positive areas in three different fields of each section were measured. Arrowheads indicate CD31-positive ECs (green). D: Arrowheads indicate Mac-3-positive macrophages (green). E: The number of apoptotic cells was counted in 10 randomly selected fields. Arrowheads indicate apoptotic cells (green). Tumor nuclei were stained in red. *, P < 0.01 compared to control mice. F: Kaplan-Meier analysis.

