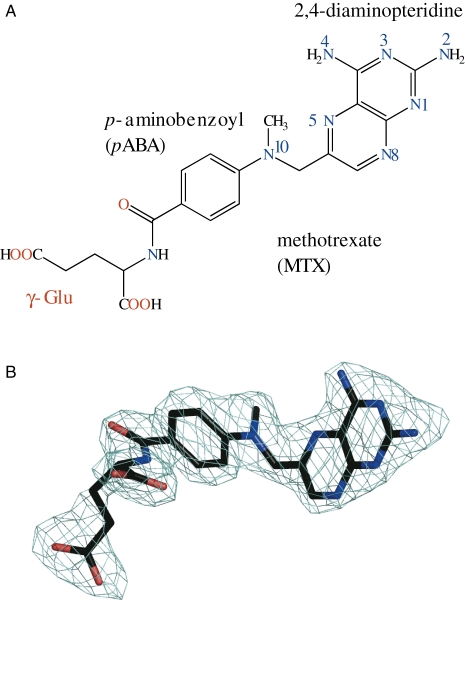
Fig. 2.
A. The chemical structure of methotrexate (MTX).B. The difference density omit map (chicken wire) for MTX in active site A, calculated with (Fo-Fc), αc coefficients and contoured at the 3 σ level. Fo represents the observed structure factors, Fc the calculated structure factors and αc the calculated phases. The atomic co-ordinates depicted in this figure did not contribute to Fc or αc.
MTX in this and subsequent figures is depicted in stick-mode with atomic positions coloured C black, N blue, O red. Figures showing molecular structures were prepared using PyMOL (DeLano, 2002).

