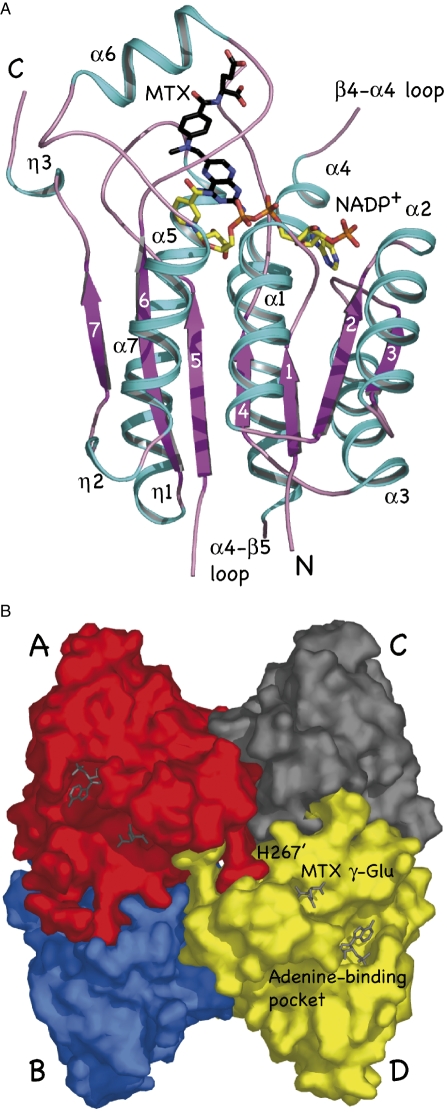
Fig. 3.
A. Ribbon diagram of the TbPTR1 subunit showing the fold and position of MTX and cofactor. Helices are coloured cyan and labelled α or η (310), β-strands are purple and numbered. Cofactor bonds are drawn as sticks coloured according to atom type; C yellow, N blue, O red, P orange.
B. Surface representation of the functional tetramer with individual subunits coloured red, blue, grey and yellow. The cofactor adenine and MTX γ-Glu moieties associated with subunits A and D are depicted as grey sticks. The view is parallel to a twofold axis of NCS. His267′ is labelled to identify the incursion of the C-terminus of one subunit into the active site cleft of an adjacent subunit.

