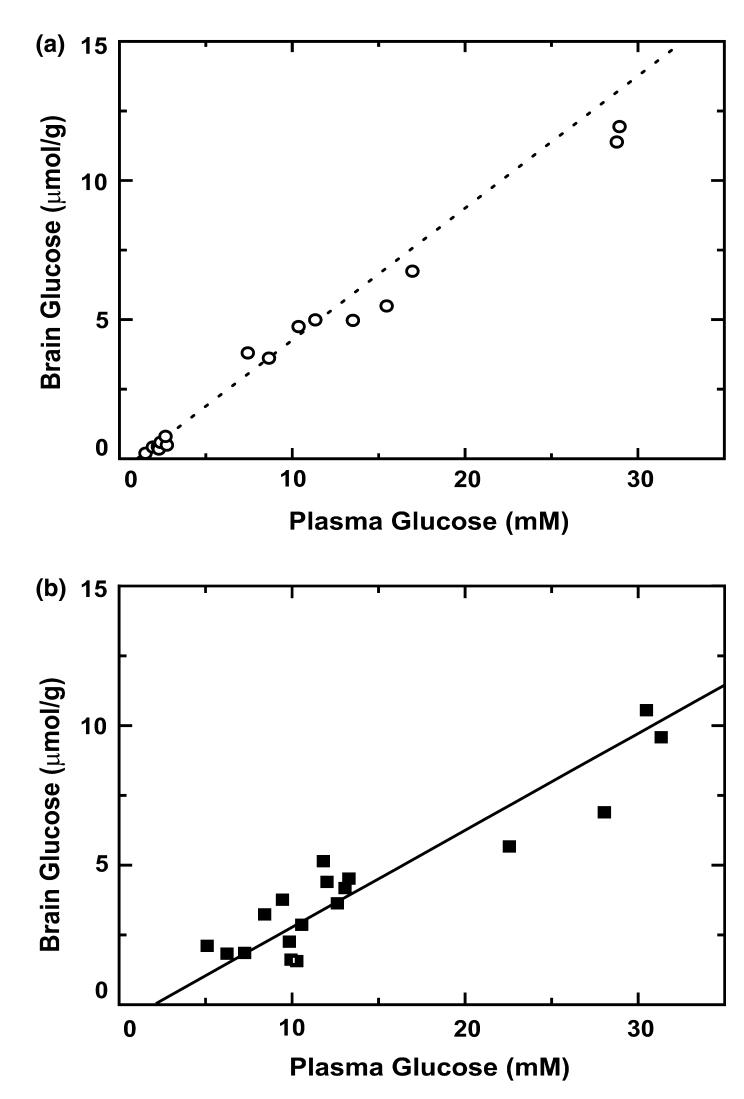
Fig. 4.
Comparison of the NMR measurements with the biochemical assay of brain glucose in both chronic hypoglycaemia (a) and shamtreated animals (b). The dashed line in (a) is identical to the dashed line in Fig. 3, and indicates the NMR quantification of brain glucose in chronic hypoglycaemia. The open circles represent the concurrent biochemical determination of glucose in the chronic hypoglycaemia group. Conversely, the solid line in (b) is the solid line from Fig. 3, and the solid squares are the respective biochemical determination of brain glucose.

