
Figure 1.
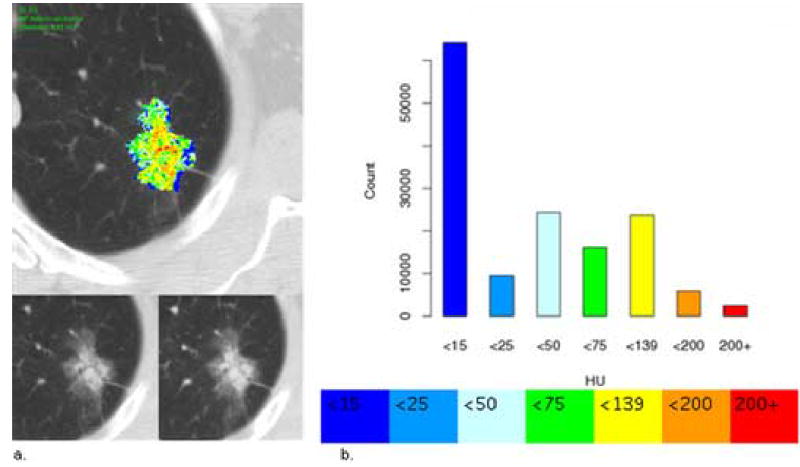
Contrast enhancement map. (a) Top: Contrast enhancement map (CEM) of an adenocarcinoma through the axial equator (single, two-dimensional [2D] representative slice from the complete 3D ROI). This nodule was visually graded by the three readers as moderate magnitude of enhancement (mean magnitude score 4) and moderate to high heterogeneity (mean pattern score 4.3). Bottom: Matched pre-contrast (left) and maximum post-contrast images (right) used to create the difference image, respectively. (b) Top: Histogram showing the color-coded voxel frequency distribution from the corresponding complete 3D ROI of the nodule. Bottom: Colors used to quantize the attenuation differences (HU).