
Figure 2.
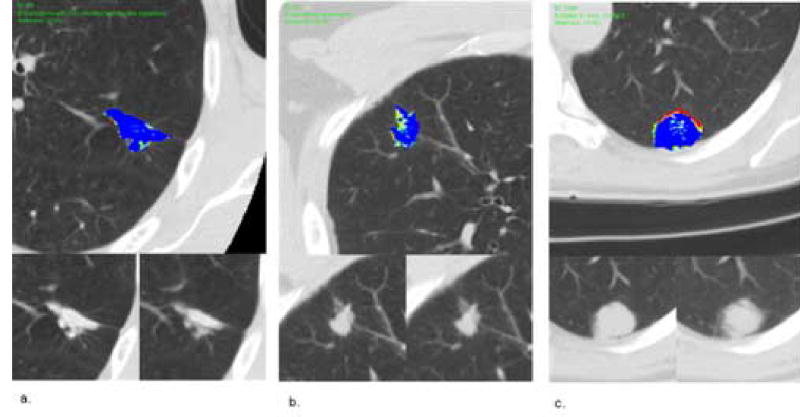
Benign nodules. (a) Top Image: Contrast enhancement map (CEM) of a benign nodule through the axial equator, granuloma with Coccidioides immitis-like organisms. Lower left: pre-contrast image. Lower right: maximum enhancement post-contrast image. Mean magnitude score 3, mean pattern score 2.7. (b) Top Image: contrast enhancement map of a benign nodule through the axial equator, necrotizing granuloma. Lower left: pre-contrast image. Lower right: maximum enhancement post-contrast image. Mean magnitude score 1.7, mean pattern score 1.7. (c) Top Image: contrast enhancement map of a benign nodule through the axial equator, stable > 2 years on radiological follow-up. Lower left: pre-contrast image. Lower right: maximum enhancement post-contrast image. Mean magnitude score 3.3, mean pattern score 2.7.