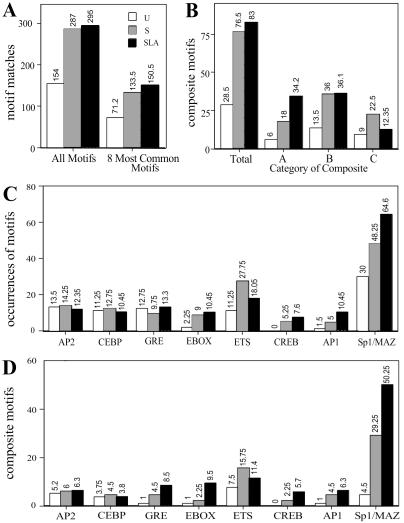
Figure 4.
Histogram of relative frequencies of motifs in unselected (U) and selected (S; SLA) sets. (A) Number of motif matches against the TransFac database. (B) Number of composite motifs in each set. (C) Frequency of eight most common motifs in each set. (D) Number of composites formed with the eight most common motifs. All numbers are per 100 Ran18 elements.

