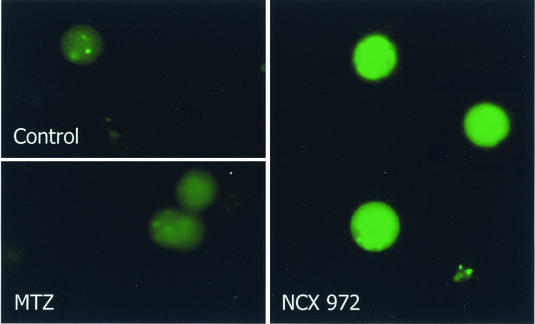
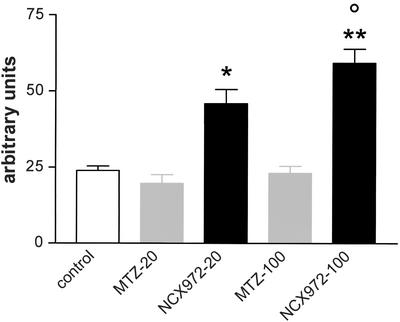
FIG. 2.
Intracellular release of NO by NCX 972 in trophozoites of E. histolytica. Cells were preincubated with DAF-2DA and then treated with a 20- to 100-μM concentration of either MTZ or NCX 972 for 30 min. Images report DAF fluorescence of trophozoites untreated (control) or treated with 100 μM MTZ and 100 μM NCX 972. Data are expressed as arbitrary units. The gray density was calculated at the single-cell level (about 100 cells/treatment condition/experiment). Bars represent the mean ± SEM (error bars) from two separate experiments. One-way ANOVA followed by Bonferroni's test was used to determine the significant differences. Symbols: *, P < 0.001 between 20 μM NCX 972 and 20 μM MTZ; **, P < 0.001 between 100 μM NCX972 and 100 μM MTZ; °, P < 0.05 between 20 μM and 100 μM NCX 972 treatments. For further details see the text.


