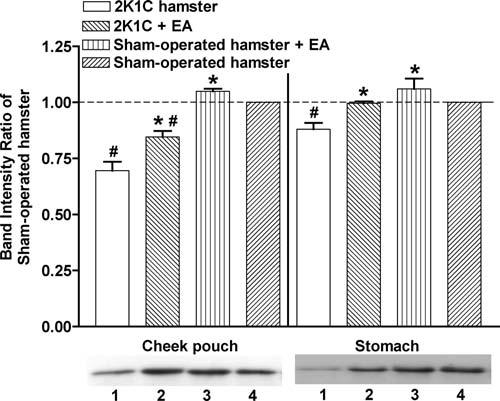
Figure 4.

Western blotting analysis of nNOS in hamster cheek pouch and stomach. The band intensities in the Western blots were divided by the band intensity of corresponding nontreated sham-operated hamster. The data represent the means ± SEM. Each group represents 3 hamsters. EA, electroacupuncture. * p < .05 compared with nontreated 2K1C hamsters, #p < .05 compared with sham-operated hamsters. The lower panel shows representative Western blot bands for each group. 1: 2K1C, 2: 2K1C+EA, 3: sham-operated+EA, 4: sham-operated.
