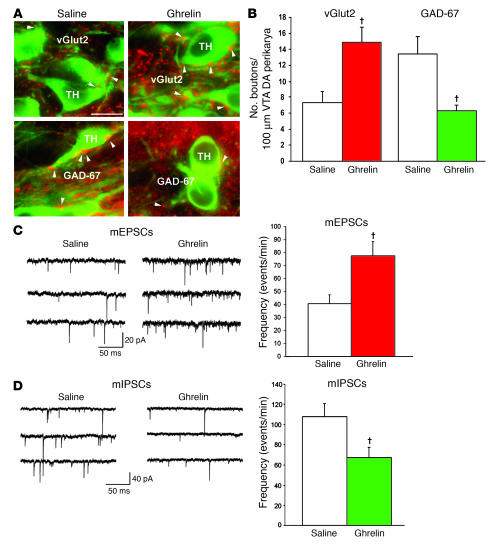
Figure 4. Ghrelin alters inhibitory and excitatory inputs of VTA DA cells.
(A and B) Appositions between vGlut2-immunoreactive (red) and TH-immunopositive (green) VTA perikarya were significantly greater in ghrelin-treated animals compared with saline-treated controls. In contrast, appositions between GAD-67–immunolabeled boutons and TH-immunoreactive VTA perikarya were significantly lower in ghrelin-treated animals compared with saline-treated controls. Scale bars: 10 μm. (C) Corresponding to the observed changes in the number of synapses by light and electron microscopy, ghrelin treatment induced a significant elevation in the frequency of mEPSCs compared with saline controls. (D) Conversely, ghrelin administration triggered a significant decrease in the frequency of mIPSCs that was also in line with the light and electron microscopy results. †P < 0.05 versus respective saline-treated controls.

