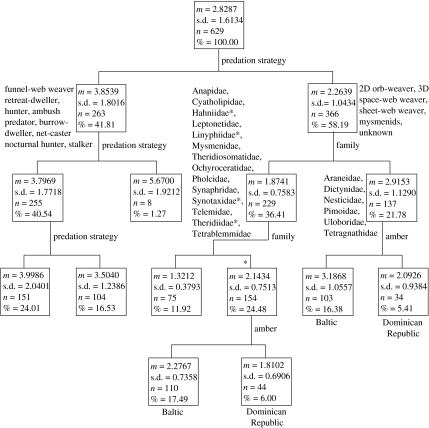
Figure 2.
Dendrogram showing a hierarchy of main predictors of spider size as modelled by regression tree analysis. The strongest predictor of size (first split) separates the dataset by predation strategy into larger non-web and smaller web spinners. Only the web spinners are ultimately classified by amber source (shown on the right-hand branch of the dendrogram).

