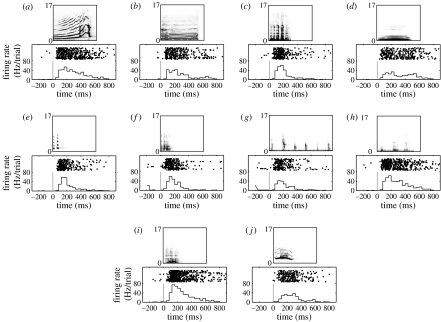
Figure 1.
Response profile of a vPFC to each of the 10 SSV exemplars: (a) harmonic arch, (b) warble, (c) grunt, (d) coo, (e) copulation scream, (f) shrill bark, (g) gekker, (h) girney, (i) aggressive and (j) scream. The rasters and histograms are aligned relative to onset of the SSV; the solid grey line indicates stimulus onset. The histograms were generated by binning spike times into 40 ms bins. Above each panel is a spectrographic representation of each SSV exemplar. The numbers along the y-axis of each spectrogram are the frequencies in kHz; its time axis can be found using the scale on the raster/histogram time axis.

