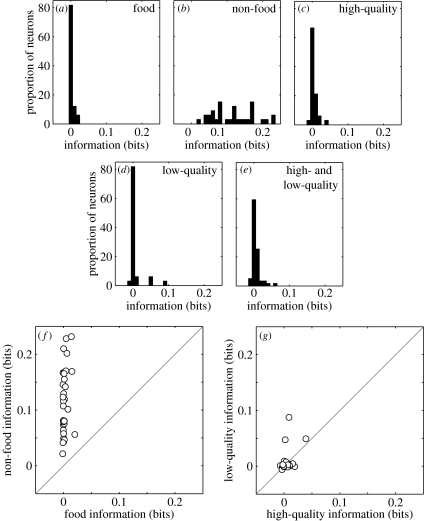
Figure 2.
Distributions of category information (in terms of bit rate) quantifying the similarity of the spike trains of vPFC neurons elicited by different categories of SSVs conveying functionally different meanings: (a) food, (b) non-food, (c) high-quality food, (d) low-quality food and (e) high- and low-quality food. (f) Correlation analysis of category information. On a neuron-by-neuron basis, the amount of categorical information generated from the food SSVs is plotted on the x-axis and the amount of category information generated from the non-food SSVs is plotted on the y-axis. (g) Correlation analysis of category information comparing the amount of category information from the high-quality food category (x-axis) with that from the low-quality food category (y-axis). The solid grey line in panels (f) and (g) represents the expected relationship if the neurons had the same amount of category information.

