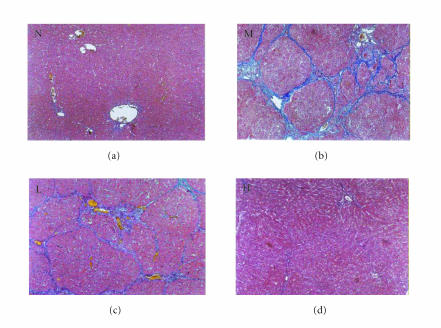
Figure 3.
Liver histopathology of the rat detected byMasson trichrome staining. N represented the normal control group;Mrepresented the model group; L represented the group treated with low dose of thalidomide; H represented the group treated with high dose of thalidomide. Fibrotic bands of liver shown in M, L, and H (original magnification N, M, L, H, ×100).

