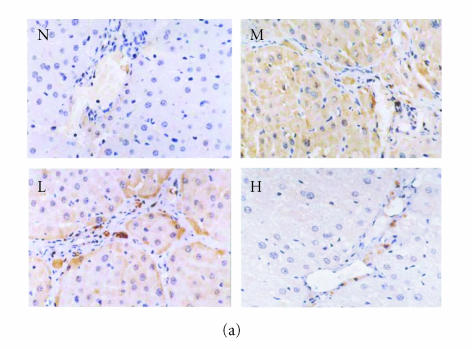
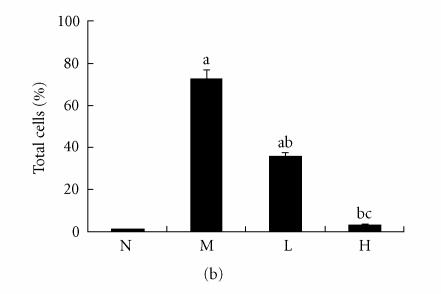
Figure 6.
Immunohistochemical staining for VCAM-1 in rat liver. N represented the normal control group; M represented the model group; L represented the group treated with low dose of thalidomide; H represented the group treated with high dose of thalidomide. (a) Positive VCAM-1 cells were mainly distributed at the fibrosepta band, area of necrosis, and inflammatory cell infiltration in hepatic lobules (M, L, and H) (original magnification N, M, L, H, ×400, immunohistochemical staining). (b) Comparison of the expression of VCAM-1 using immunohistochemical analysis. aP < .01 versus normal control group; bP < .01 versus model group; cP < .01 group treated with high dose of thalidomide versus group treated with low dose of thalidomide.


